This is a basic example which shows you how to run sensitivity analysis on pre-loaded parameters.As a pre-requisite, install package using
if (!require("geohabnet")) {
  devtools::install_github("GarrettLab/CroplandConnectivity", subdir = "geohabnet")
}
Package offers 2 ways to use custom raster file - using
parameters.yaml and sa_onrasters which is also
used internally to create raster object using the provided source.
Loading package
if (!require(geohabnet)) {
  install.packages("geohabnet")
  library(geohabnet)
}
#> Loading required package: geohabnetSet the file parameter under Hosts to the
absolute path of raster file -
Hosts:
      monfreda: ["avocado"]
      mapspam:
      file: "full-path-to-tif/avocado_HarvestedAreaFraction.tif"
Feed the updated parameters to package -
set_parameters("parameters.yaml")Raster files ends with extension .tif. Since, the
internal workflow only uses harvested fractional area of a cropland, we
recommend using raster files as specified in this dataset.
For this particular example, we will use
spam2017V2r1_SSA_H_BEAN_A.tif from the
monfreda.
# Generate raster object
# replace the tif file with actual path after download
rr <- get_crop_raster_fromtif("spam2017V2r1_SSA_H_BEAN_A.tif")
rr
class : RasterLayer
dimensions : 2160, 4320, 9331200 (nrow, ncol, ncell)
resolution : 0.083333, 0.083333 (x, y)
extent : -180, 179.9986, -89.99928, 90 (xmin, xmax, ymin, ymax)
crs : +proj=longlat +datum=WGS84 +no_defs
source : spam2017V2r1_SSA_H_BEAN_A.tif
names : spam2017V2r1_SSA_H_BEAN_ATo ensure we have the correct raster,
terra::plot(rr)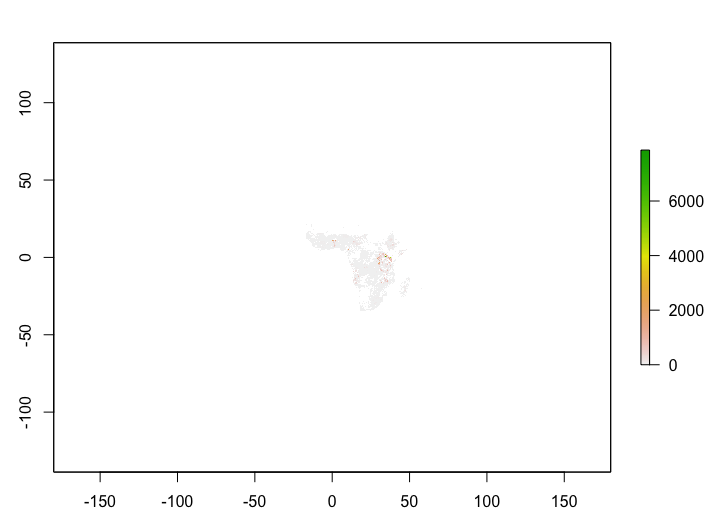
Next, once you have all the values ready, run risk analysis with
geohabnet::sa_onrasters()
geohabnet::sa_onrasters(cropharvest_raster = rr,
geo_scales = list(c(-50, 50, -50, 50)),
link_thresholds = c(0),
host_density_thresholds = c(0.0000015),
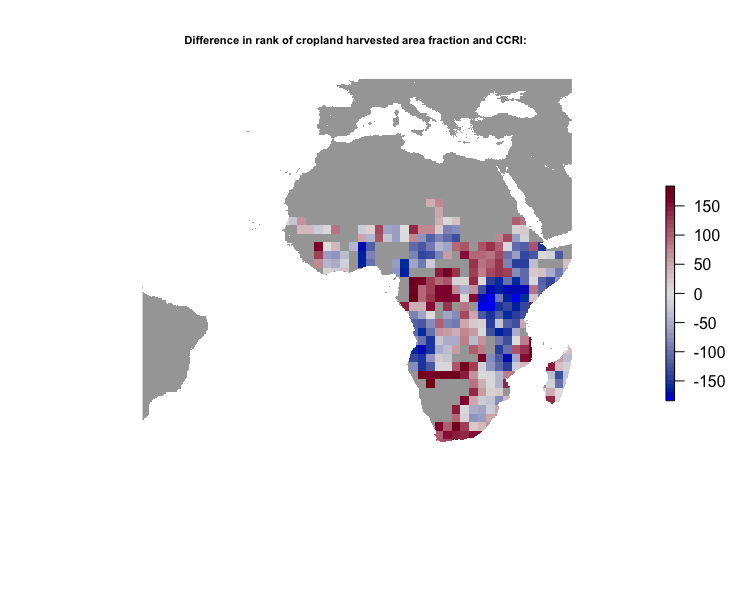
res = 24)On successful analysis, function will produce output maps. See example below.
If the extent is incorrect and no valid cells can be discovered based threshold, then analysis will be interrupted and error will be thrown -
Error in .extract_cropland_density(the$cropharvest_aggtm_crop, host_density_threshold) :
  host density threshold:  0.00015  is greater than the max value:  -Inf  of aggregate raster